
TAU implements new technology to continue delivering reliable electricity to Rarotonga
March 24, 2025
Te Aponga Uira to progress renewable energy through partnerships
June 25, 2025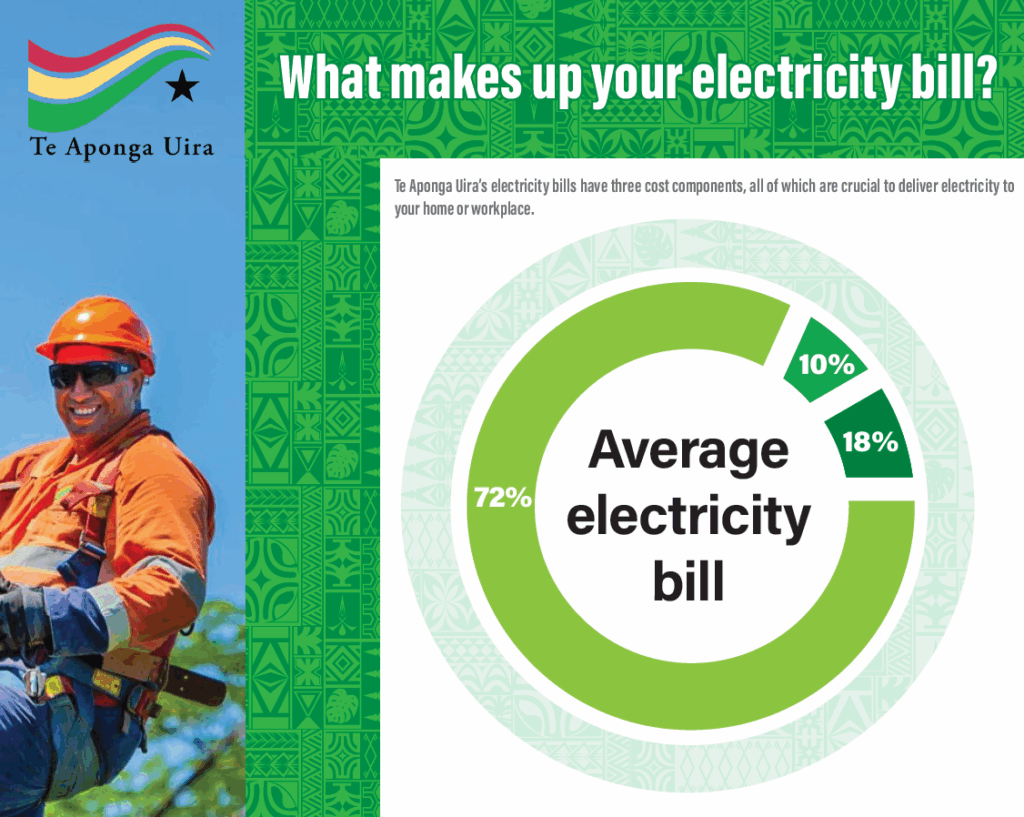
Te Aponga Uira (TAU) has today published two simple graphics for customers to help them understand how to read their invoices, and to see what makes up each bill.
The graphics have been created in response to TAU’s 2024 customer survey, where customers asked for more information on how to understand their invoices and the costs that go into each bill.
The graphic, What makes up my electricity bill? breaks down the four areas of cost in each bill. They are:
- Generation costs: 72% of each bill. This includes the costs to buy and store diesel, generate electricity using diesel, and the costs to store and distribute solar energy.
- Network costs: 10% of each bill. This includes the costs to maintain the poles, wires, cables and substations that distribution electricity around the island and to your home or business.
- Operating costs: 18% of each bill. This cost relates to our customer service and finance teams, meter readers, and our 24/7 fault line. It also includes our community sponsorships, and supplying street and coloured lights.
- VAT: Just like any other business, TAU has to pay value-added tax of 15% on the services it delivers. So, VAT is also added to your bill.
The graphic, How to read your electricity invoice, illustrates the various parts of your monthly TAU electricity invoice. It explains how to understand meter readings, domestic tariffs, and the balance you need to pay.
“These graphics continue TAU’s commitment to responding to what our customers are asking for – simple information so they can make smart decisions about electricity use in their homes and businesses,” says TAU Chief Executive Officer, Lesley Katoa. “The breakdown of the bill graphic shows that generation costs make up the majority of our costs, and also reflects that renewable energy also comes at a cost – to store, dispatch, and balance generation with demand. The graphic on how to read your invoice is particularly timely given TAU has recently launched functionality for customers to submit a meter reading via photograph, if their estimated reading is more than 50 units higher than what has been used.
“Tools like these are part of our ongoing work to achieve our vision of empowering the community through sustainable and innovative energy solutions.”
END
This press release was updated on 14 July 2025 to more accurately reflect the VAT component of bills, to make it clearer for our customers about the costs they pay for in each Te Aponga Uira bill.

